On April 19, 1996, when a tornado struck southeast Urbana, David Wojtowicz, a senior research programmer in LAS's Department of Atmospheric Sciences, was reminded of how vital his online weather page had become to the campus community. Weather conditions had changed abruptly and violently. Several neighborhoods were damaged. Parts of a nearby town were leveled. "It'd been the only time in recent memory that the community had been directly affected," says Wojtowicz. "It left people jittery, and in our information-driven age they wanted to keep their fingers on weather conditions faster than information could be provided by weather forecasts. So they turned to us."
Nearly a decade later, the community is still turning to the department's website for their daily weather news fix. Even with dozens of competing services to choose from, they prefer to get their on-demand forecasts from the website that started it all.
In 1991, the Department of Atmospheric Sciences launched the world's first online weather page (as nearly as could be determined). The site was then called the "Weather Machine," and was mostly text-based. In those pre-Web browser days, there was no cost-effective way of delivering real-time radar images to the public. That all changed in the mid-1990s with the release of Mosaic (at U of I), which sparked the proliferation of the Web and the many weather websites seen today.
During central Illinois' spring severe storm season, the department's weather page may be one of the most accessed sites on campus. "On average, a weather image or page is accessed 242,000 times a day," says Wojtowicz, who helped create the first site and its permutations. "On 'interesting' weather days it often hits half a million." When tornado sirens go off, the surge in traffic can crash the site. (Wojtowicz hopes to solve the problem soon by adding more servers.)
Not surprisingly, most of the traffic is from campus, but there is a sizable audience in the 44-county region of east-central Illinois covered by the forecasts. The weather maps are also used as teaching tools in the ATMS100 classes. Some people have the weather page open all day, says Wojtowicz, who will get phone calls if someone doesn't think an image is updating fast enough. "In addition to tracking storms they want to know if they are going to get wet when they walk across the Quad."
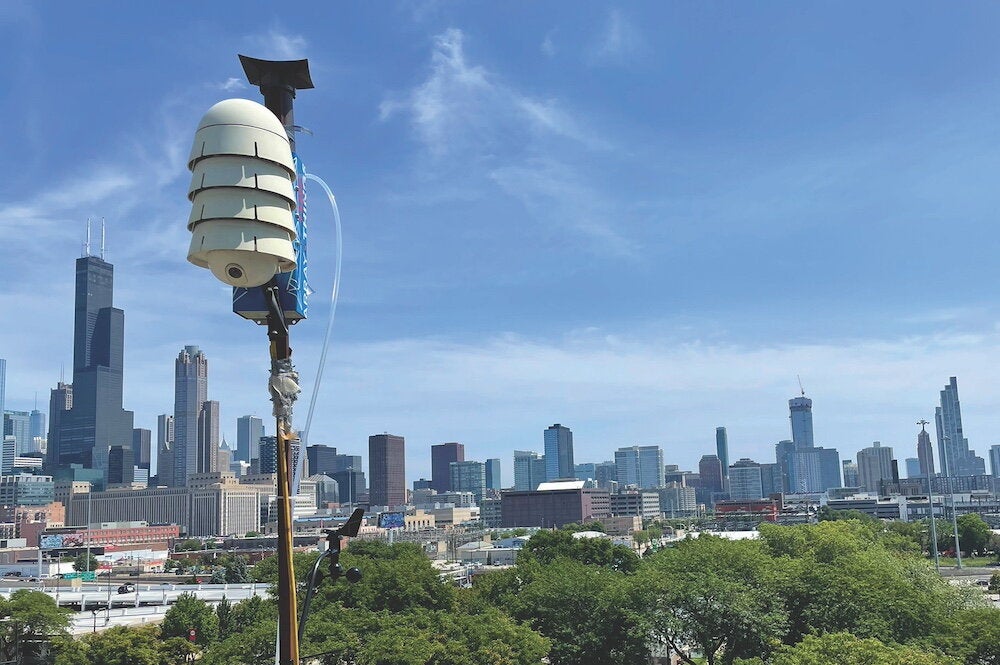
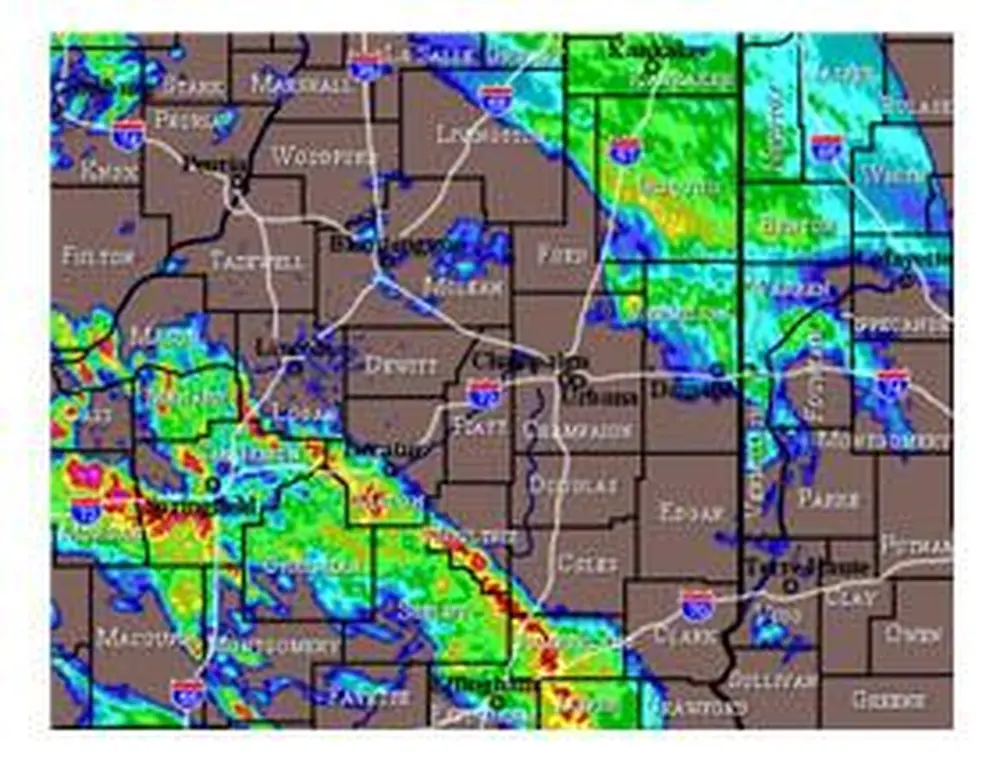
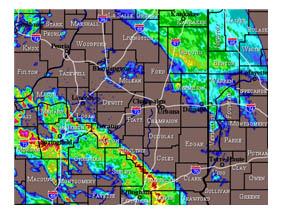
The National Weather Service provides basic data-temperature, humidity, wind speed, dew point, visibility, barometric pressure, and satellite and radar data-which are then presented in eight different maps including two local radar maps. Meteorologists at WILL AM-FM-TV, the on-campus public radio and PBS affiliate, write forecasts periodically throughout the day. When they leave for the day, the National Weather Service forecasts automatically take over. A live Web cam image from atop Beckman Institute gives visitors a view of the skies.
Wojtowicz wants to add even more radar pictures for those meteorological aficionados he affectionately calls "weather geeks." He also wants to add another camera, this one focused on the Quad, because it might boost the site's traffic on nice days. Afterall, watching students lounging on the green would be kinda like playing hooky.