
Breaking news: There is a good reason why people who drive fast are described as having a “heavy foot.” A University of Illinois survey has shown that shoe size determines how fast a person will drive. The bigger the shoe, the faster the driver.
“But is this really true?” asks Ellen Fireman, an LAS senior lecturer in statistics.
On one level, it certainly appears to be true, for this survey result came from Fireman’s very own introductory course on statistics. A survey of 1,100 students in Statistics 100 showed that the bigger the shoe, the faster the driver. But although there is a slight correlation between shoe size and speed, correlation doesn’t always mean causation.
Taking a closer look at the data, Fireman’s class discovered that what lay behind the result is the fact that males generally wear larger shoes, and males generally drive faster than females. Gender was the true causal factor, not shoe size.
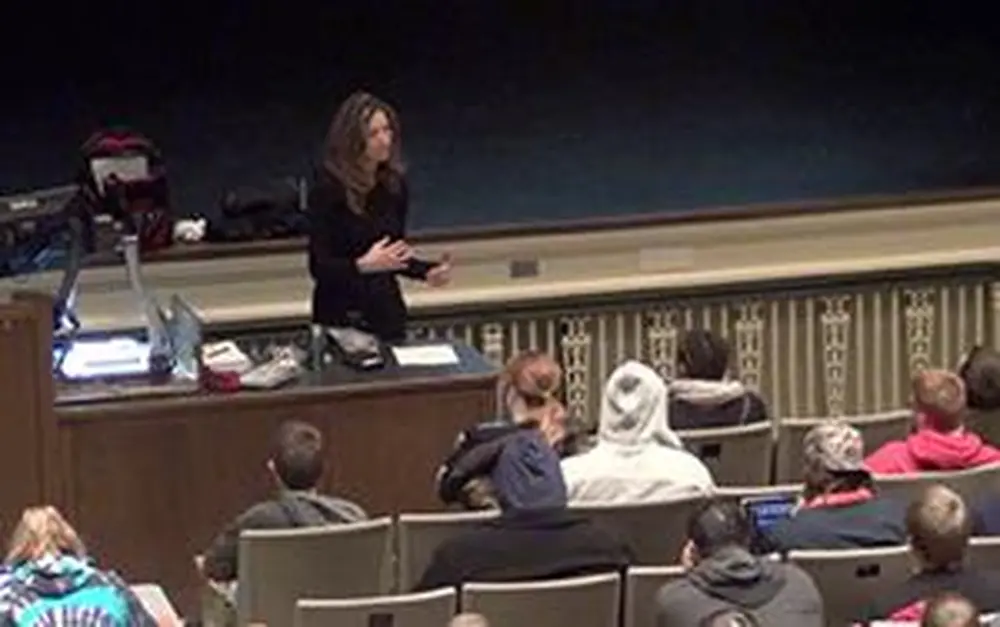
The shoe size question makes for an oddball survey, but Fireman uses unique examples like that to teach statistics in a captivating, and, more importantly, effective way. Her class is extremely popular, and Fireman consistently scores high marks in student approval; as a past recipient of the Lynn M. Martin Award for Distinguished Women Teachers and the Campus Award for Excellence in Undergraduate Teaching, she is also highly regarded by colleagues.
However, Fireman didn’t set out to teach statistics when she began her career in the early 1970s, despite her love for mathematics and problem solving. As a child of the ’60s growing up in Newton, Mass., she did not think math was relevant at the time and focused instead on political change. She majored in philosophy and then moved to California, the country’s flower-power center, where she worked with children and even had a brief stint driving an 18-wheel truck.
Fireman came to Illinois when her husband, Michael Weissman, joined the physics faculty, and at U of I she returned to her mathematical roots, teaching classes such as linear algebra. In 2000, she started teaching Statistics 100, and she noticed that she didn ’t get the usual math-class question, “When will I ever use this in real life?” She says most students see statistics as important, but that doesn’t mean they embrace it. On the contrary, many are intimidated by it.
“I don’t think most of us are hard-wired to think mathematically,” she says. “As a result, many students feel powerless when it comes to learning statistics or any type of math. ”
So Fireman set out to bring power to the people by making statistics accessible to all. The key, she says, is that the class puts the focus on every person’s favorite subject—themselves. She conducts five or more voluntary online surveys each semester, and all of the data collected is about the students. Because of the enormous size of the class, the data is meaningful and anonymous, and she never uses the results beyond the classroom, where students enthusiastically analyze the findings.
Fireman begins each semester with a simple survey that asks the students basic questions such as gender and height, but also includes quirkier questions such as, “How many shoes do you own?” or “What is your shoe size?” or “What’s the fastest you have driven? ” or “How much money do you have in your pocket now?” For instance, this survey recently found that female students owned an average of 12 pairs of shoes, while males owned an average of 5.5.
Other surveys given throughout a semester cover seasonal topics, such as views about Halloween, views on love around Valentine’s Day, or political views near election day. Some surveys even tackle controversial issues, from the death penalty to abortion, or ask whimsical questions such as what is the best way to place a roll of toilet paper on the spindle. (Most men don’t care; most women do.)
By analyzing these surveys, students learn how poorly worded questions can greatly influence the results, and how the order of questions can alter responses. They also learn how to judge when a study might have a “confounder”—a result that only makes it appear that one thing causes another. Gender was a confounder in the survey on shoe size and driving speed.
Fireman says her students now read newspapers in an entirely different way; in fact, they can often evaluate survey results better than the journalists covering the topics for major newspapers. They know which studies you can trust, and which studies you cannot.
“People feel very scared of statistics, and they don’t trust the studies,” she says. “So I feel that my job is to help them understand enough statistics so they are not fooled and can understand what is going on. I compare my course to getting a driver’s license. I’m just trying to give people the tools they need so they can get out on the road.”


