Introduction Overall Climate Index Equitable Practice Indices Incivility or Harassment Departmental Climate & Belonging Diversity & Inclusion Practices, Policies, and Processes
Dashboard overview
In Spring 2023, the Office of Inclusive Excellence (IE), on behalf of the College of Liberal Arts & Sciences, conducted a college-wide survey to assess aspects of departmental climate and culture. Invitations were extended to the entire LAS community, including faculty, staff, and students (both graduate and undergraduate). The project timeline was as follows:
- Fall 2022 - Climate survey instrument finalized by an LAS committee representing units from across the college. IRB approval obtained
- Spring 2023 - Responses gathered from participants
- Summer/Fall 2023 - Quantitative data analysis
- Spring 2024 - Qualitative data analysis and report write-up for individual units
- Summer/Fall 2024 - IE staff met with leadership from all LAS units to deliver and review unit-level results
- Fall 2024/Spring 2025 - Units developed strategic plans to address the survey results and submitted them to IE
- Spring 2025 - Climate survey dashboard development IE team partnered with units to review strategic plans in as-needed basis
- Fall 2025 - Dashboard refinement and deployment
- Fall 2025/Spring 2026 - Departmental progress reports
With this dashboard, our goal is to invite stakeholders to better familiarize themselves with the climate survey results, at the college level. Dashboards serve as powerful tools for visualizing and managing complex data, bringing clarity to intricate processes and metrics, and providing transparency about the data that were collected from our community.
The information represented in this dashboard focuses on the academic portfolios within the college. These are the Social and Behavioral Sciences, Humanities and Interdisciplinary Programs, and Natural and Mathematical Sciences. For department-specific data, users can contact their unit’s Executive Officer, who has reports with quantitative analysis at the unit and cluster level (clusters are groups of small units with similar characteristics).
How to use this dashboard
Our aim is to provide access to information in several ways. Directly below the header banner on the left-hand side, you will find a toggle down arrow. By clicking on this arrow, you will be taken to a directory similar to a table of contents. You can select any of the options listed which will take you directly to that area. Click on each tab for additional information about the section. Additionally, this information is found in the tabs to the right of the down arrow. For example, you will find the following tabs below the header banner: Introduction, Overall Climate Index, Equitable Practices Indices, Incivility or Harassment Questions and Departmental Climate. As you continue to scroll to the right, you will see additional topical options that may be of interest.
- Visualization Type: You can select from two options: Box plots or tables based on your preference.
- Academic Groups: You can filter data based on the academic portfolios which include the Natural and Mathematical Sciences, Humanities, Social and Behavioral Sciences, and Administrative Units.
- Select Demographic Groups (Primary and secondary): Select (by clicking the box) the category you are interested in.
- Filter Demographic Groups (Primary and secondary): This allows you to filter based on the selected demographic status.
Reading individual box-plots
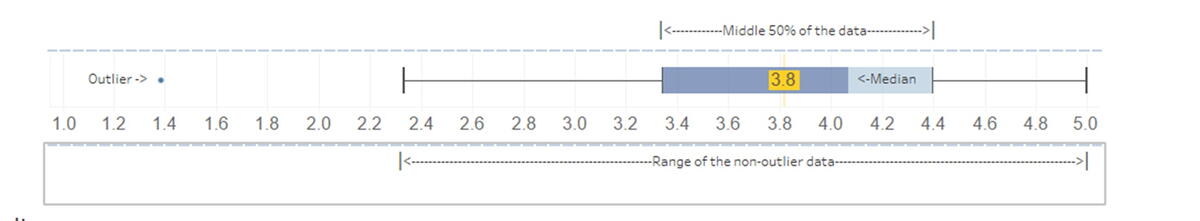
Box-plots are provided for each row of entry for survey indices. The colored box represents the middle 50% of the data. The change in shade within each box indicates the median. Each individual colored dot indicates an individual’s response that is considered an outlier. The black horizontal T-shaped line (whiskers) represents the range of all the non-outlier responses. The average is also provided in the form of a yellow box and vertical line. Please note the boxplot statistics are not weighted.
Sample box-plot
Survey results
Survey results are generally presented in the same order as the survey instrument. Survey takers of different employment levels might have seen slightly different versions of some survey questions, but all questions are included in this dashboard unless otherwise redacted following IRB guidelines. Most survey questions follow a 5-point scale where higher scores are better, unless the question is stated to use an inverted scale, then lower scores are better. It should be noted that this dashboard does not contain all the survey questions and created survey indices but a curated selection. Please refer to the HTML report for results on all the survey questions and indices.
Result visualizations
Readers may notice a different number of responses for each visualization. Respondents were free to skip any question they did not want to answer, aside from the first question asking for consent, and some questions were only shown to respondents who answered a certain way on a previous question or belonged to a particular demographic category. For example, if a respondent indicated that they had never experienced harassment, then they would not be shown questions about the characteristics of that harassment. Similarly, some questions were specifically designed for specific employment categories. For example, faculty were asked about tenure fairness and equity, while graduate students were asked about teaching assistants (TA) assignments and funding.
Crosstab download
Readers may download the crosstab via the download button located near the top right area of the Tableau module. Please use the crosstab option to download.
Please note that the scatterplot and boxplot visualization found on the Introduction page will have incorrectly formatted crosstabs due to a limitation within Tableau; please refer to the associated footnotes for an interpretation of the visualization.
Also note for boxplot visualizations in Overall Climate Index and Equitable Practices Indices, the crosstab will not be formatted correctly due to the same limitation. We encourage you to download the crosstab from the associated Tables found under the same page as a substitution.
Please note that the crosstab downloaded only contains the data of the currently active selection and filters.
To download the data,
Find this button on the top right:
Image
- Choose the individual sheet of interest.
- Choose crosstab.
- Choose CSV format to download.
Appendix/Q&A items
Response rates
The response rates for faculty, staff, and graduate students are higher than the typical response rates observed in comparable University of Illinois faculty and staff and student surveys conducted by CITL. The lower response rates for postdocs and student employees are typical for student surveys. LAS undergraduate students were also asked to participate but it was determined that their observed response rate (3.4%) was not high enough to yield meaningful results. Therefore, undergraduate students are excluded from this report.
To mitigate potential non-response bias, a coordinated approach was undertaken, including the use of multiple reminders and invitations originating from both college-level and departmental sources. Reminders were sent only to individuals who had not yet completed the survey. Throughout the survey administration process, a diligent monitoring of response rates was maintained, with a focus on continuous improvement.
All demographic groups information below comes from Banner administrative data.
| Total response rate | Response rate by employment status | Response rate by sex | Response rate by administrative race | Response rate by international status |
| 1,503 (30.28%) | Faculty - 502 (37.4%) | Female - 835 (34.1%) | White - 845 (34.2%) | Domestic - 1,201 (33.4%) |
| Graduate students - 619 (26.4%) | Male - 628 (25%) | Hispanic - 110 (32.2%) | International - 302 (22.1%) | |
| Staff - 297 (43.9%) | Asian - 85 (19.4%) | |||
| Other employment categories - 85 (14.3%) | Multi-race - 58 (50.4%) | |||
| Black/African American - 57 (28.6%) | ||||
| AIAN - 5 (55.6%) |
Respondent demographics
The respondent demographics capture the distribution of the respondents that completed the survey. The percentages are NOT response rates.
The percentages are the number of demographic type out of the total number of respondent (e.g. Number of females out of the number of respondents that completed the survey).
All demographic groups information below comes from Banner administrative data.
| Total number of respondents | Respondent distribution by employment category | Response rate by sex | Response rate by administrative race | Response rate by international status |
| 1,503 | Faculty - 33.4% (502) | Female - 57.1% (835) | AIAN - 0.4% (5) | Domestic - 79.9% (1,201) |
| Graduate students - 41.2% (619) | Male - 42.9% (628) | Asian - 7.3% (85)
| International - 20.1% (302) | |
| Staff - 19.8% (297) | Black/African American - 4.9% (57) | |||
| Other - 5.7% (85) | Hispanic - 9.5% (110) | |||
| Multi-race - 5.0% (58) | ||||
| White - 72.8% (845) |
Survey index questions and choices
The phrase "In the last 12 months" refers to the 12 months between Spring 2022 and Spring 2023.
Title
About the survey
Survey background
A climate survey was conducted by the College of Liberal Arts and Sciences (LAS) and the Grainger College of Engineering (GCOE) in collaboration with the Center for Innovation in Teaching and Learning (CITL) during spring semester 2023. Survey questions were developed by a College of LAS committee working on inclusive excellence and cover a variety of topics related to diversity, equity, and inclusion. This survey was administered to all faculty and staff as of February 28, 2023. In addition during that time, LAS also surveyed all graduate and undergraduate students. Administrative data was provided by the ATLAS data group.
Weight
A calculated weight was applied to the survey data as a measure to estimate the true university population. This weight is a post-stratification rate that aims to account for differential non-response and was constructed based on college, department, employment group, sex, and underrepresented minority group status. All data presented in this report is weighted except for response rate tables and boxplots.
Definitions and descriptions
Download a spreadsheet of definitions or a spreadsheet of demographic descriptions used within the survey.
Credits
- Project sponsor(s): Venetria K. Patton
- Survey administrator(s): Dawn Owens
- Dashboard developer(s): Yuchen Wang
Contact: Please contact Dr. Maryalice Wu for any questions